6 minute read
9 data mining applications that deliver business value
The right data mining applications can lead to a strong business growth. Here are 9 that boost revenue and delight customers.
Table of contents
In a world ruled by data, streamlining your ability to leverage it is the key to successful growth and development. As data mining techniques become increasingly sophisticated, so does the value you can extract from them.
Let's take a closer look at 9 data mining applications that improve your company's bottom line, and how you could implement them.
Application #1: Trend detection
Trend detection is the backbone of trend analysis. It allows you to gather data necessary for generating valuable insights into current and future market and consumer behaviour. Therefore, determining the key characteristics of your market and consumers begins with data mining.
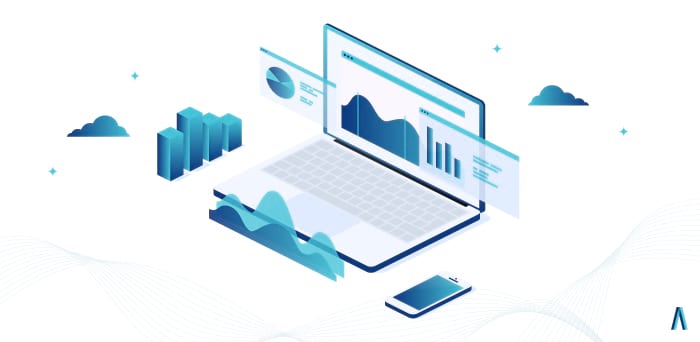
Discovering data trends involves a variety of methodologies, including:
-
Mann-Kendall test – evaluating whether a set of data values is increasing or decreasing over time and how this increase or decrease is statistically important.
-
Filtering and smoothing– getting a trend from a set of noisy data (filtering) while assigning priority to new data (smoothing).
-
Seasonal Kendall test – test for analysing seasonal trends.
While this may sound a bit overwhelming, with the right data mining tools, the trend detection process is automatic for the user. You receive the necessary data wrapped in a pretty wrapper to help you make business decisions.
Fancy words and terms aside, trend detection allows you to predict what will happen in the market by analysing what has already happened.
Application #2: Sentiment analysis
Sentiment analysis is a variation of text mining. The process identifies subjective information in the text and helps marketers understand the emotions behind online commentary about the brand, product, or service.
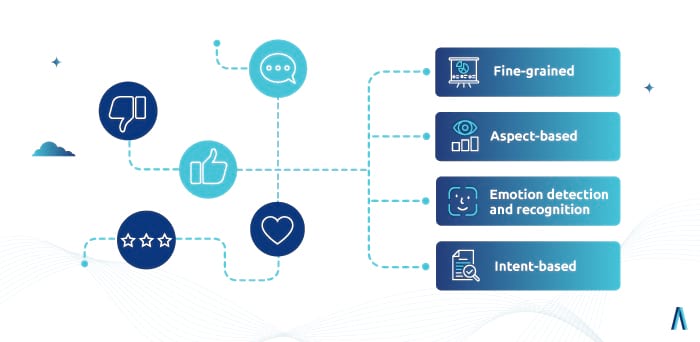
Sentiment analysis allows you to filter customers' feedback. As a result, you can identify negative and positive connotations in their words.
Doing this manually is possible but extremely time-consuming.
That's where data mining tools come in. These tools analyse textual comments to evaluate the tone and intent of each message.
After processing the data, they can demonstrate it as charts and graphs to help you identify feedback trends.
This information carries significant value for your marketing and sales team, allowing you to:
-
Organize and report feedback
-
Make adjustments to your offers
-
Build stronger relationships with your clients
-
Provide relevant answers to customers' questions
-
Identify new pain points
-
Improve customer service
Overall, data-powered sentiment analysis is the driving force behind many aspects of marketing, sales, and brand-building strategies.
Application #3: Entity relationship mapping
Entity relationship mapping uses data to understand the relationship between specific entities, such as people, things, or companies.
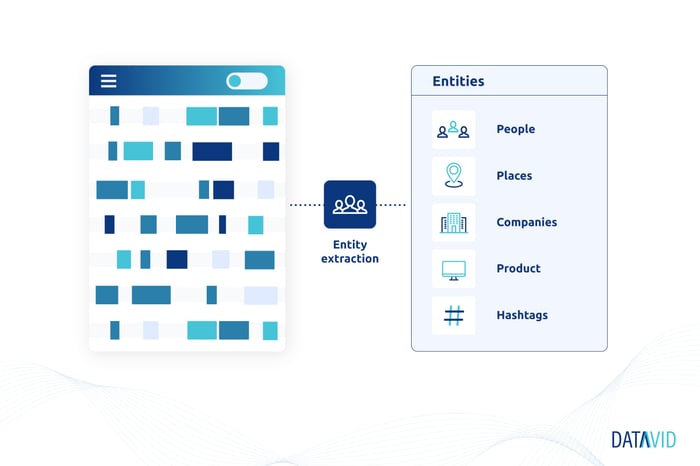
Understanding how customers or companies relate to each other can help your team draw valuable conclusions.
An example of entity relationship mapping is customer relationship mapping. It allows you to create a visual representation of a customer's account that demonstrates key decision-makers and their relationships.
Understanding who these decision makers are (for example, multiple stakeholders) and their relationship can help you find ways to influence them to achieve your business goals.
Additionally, you can use this technique to streamline operations within your own organization by mapping relationships between departments and co-workers.
Overall, visual representation of internal relationships and processes can help new team members fit in organically. Consequently, they can start working on revenue-generating tasks where they are needed most.
Application #4: Research data catalogues
Research data is expensive and hard to gather. However, that's what makes it so valuable. Sharing research data is vital to various business processes across many industries, including health care, oil and gas, education, and many more.
A data catalogue is an organized collection of data assets that allows simple access, navigation, enrichment, and shareability.
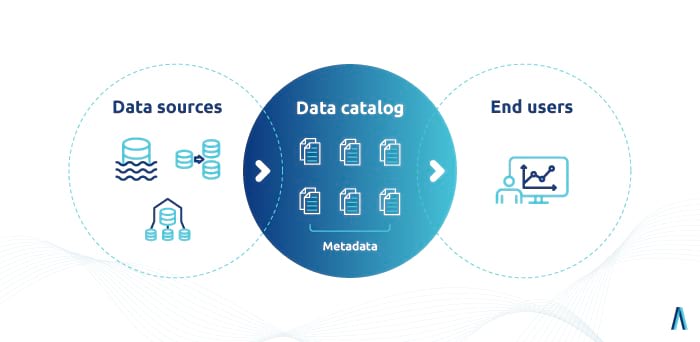
With datasets residing on local networks, personal cloud storage, or worse, flash drives, it can be hard to ensure shareability.
Conversely, creating research data catalogues allows data professionals within your organization to discover relevant information for analytics or decision-making.
Key benefits of building research data catalogues include:
-
Easy data navigation coupled with simplified data processing.
-
Clear data access hierarchy.
-
Higher research data efficiency for all users.
-
Improved shareability.
-
Better data analytics.
-
Lower chances of errors.
This data mining application is mostly internal.
Specifically, its goal is to help you build a searchable knowledge base, which, in turn, streamlines business operations.
Additionally, you can turn research data catalogues into a knowledge base for your customers and clients. This can improve customer satisfaction rates and reduce the burden on your customer support team.
Application #5: Predictive analytics
Predictive analytics allows you to predict future events based on historical data. However, these predictions require a comprehensive approach to data mining, statistical algorithms, and machine learning.
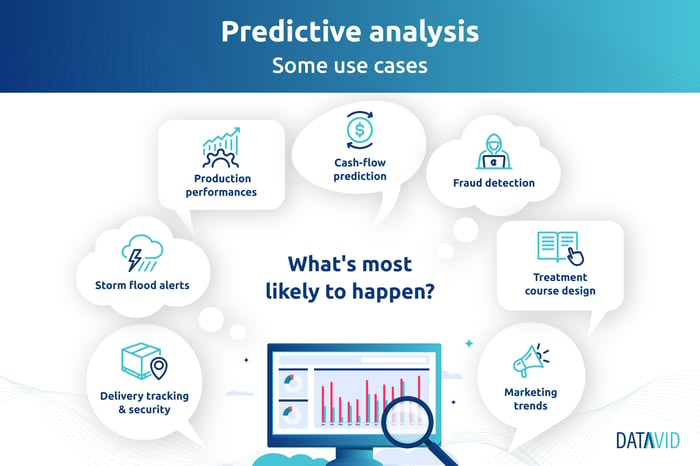
Consequently, this valuable instrument is only as good as the quality of data you can mine. Even the most robust analytics tools can't produce a high-quality outcome without excellent raw data.
What are some applications of predictive analytics?
Use this approach to prevent cybersecurity attacks, improve marketing campaigns, streamline internal operations, and reduce business risks.
Above all, the key application of predictive analytics for many companies is market stability evaluation.
Others focus on managing existing resources, discovering customers with the highest possible lifetime value (LTV), and forecasting inventory.
Certainly, data mining and predictive analytics are closely related.
The former identifies, organises, and explores data patterns. The latter extracts information from data patterns and uses it to make predictions.
Application #6: Compliance checks
The costs of maintaining compliance are rising. In past years, for some organisations, they increased by more than 60%.
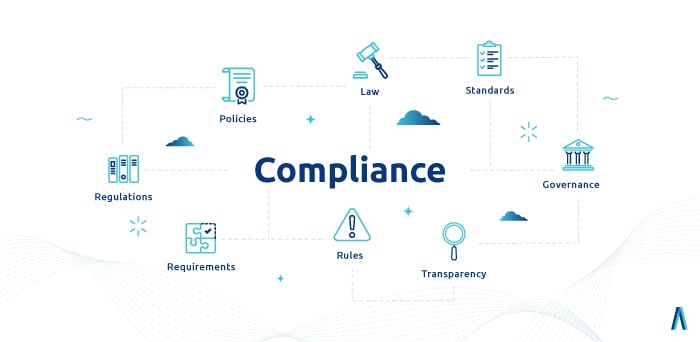
However, compliance errors are even more damaging.
They lead to significant expenses, downtime, reputational issues, and more.
To avoid these issues, organisations arrange rigorous compliance checks.
Data-driven compliance identifies errors before they turn into non-compliance and associated costs.
A simple example of data-driven compliance is the use of patient management systems. The software developer provides all the necessary maintenance, operation, and management instructions to the user.
Healthcare providers must access this data to ensure precise operations, timely updates, and patient data safety for HIPAA compliance.
As a result, this is possible only with the right approach to data mining.
Application #7: Classification and labelling
Data classification is a method of organizing data into metadata-based categories, so it becomes easily accessible to the user.
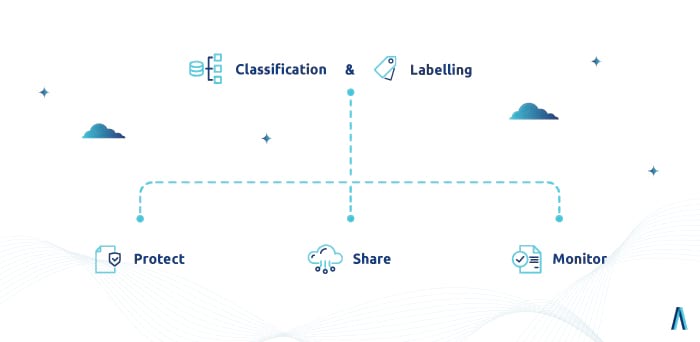
Meanwhile, data labelling is the process of identifying raw data and adding labels to give it context.
Data classification and labelling are integral parts of training ML models.
For example, if your business relies on artificial intelligence and machine learning to assist with decision-making, you need proper labelling and classification tools.
To train, ML models require high-quality data. However, not all high-quality data is useful to the artificial algorithm. If it's not labelled and organized properly, the machine can't use it for analytics and predictions.
Classification in data mining is a common technique that allows you to organise data just as you would for an AI-based algorithm.
Popular classification techniques in data mining are:
-
K-Nearest Neighbor.
-
Logistic regression.
-
Naive Bayes classification.
Data mining can involve a variety of classification algorithms with unique functionalities. The application depends on the current task and data extraction goals.
If this is all Greek to you, don't worry. Data mining tools leverage these processes to provide high-quality readable and visual data for the end user.
Application #8: Text extraction (images)
Text extraction is the process of using machine algorithms to recognise and process text from an image, so you can use it for further analytics.
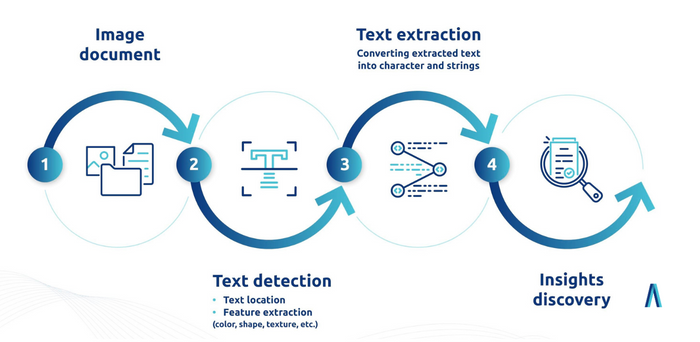
Pulling text directly from the image saves time and money while streamlining data processing efforts.
In addition to making the text usable, text extraction assists with data access. If you need to browse data for quick decision-making, the text is highly searchable, while images aren't.
In short, text extraction is a valuable text mining assistant.
Key benefits of text extraction tools include:
-
Better audit compliance: You can arrange document inspections without struggling with images.
-
Improved accuracy: Text extraction tools help you avoid human error when processing data within the image.
-
High data quality: Images often come in poor resolution, making them hard to read for humans. Data extraction tools can handle low-quality images and turn them into usable data.
Ultimately, extracting text from images is a simple form of data mining that helps with data analytics, compliance, decision-making, and customer satisfaction.
Application #9: Sales forecasting
One of the most useful applications of data mining is predictions. Having a large volume of organised historical data at your fingertips is the key to gaining actionable information.
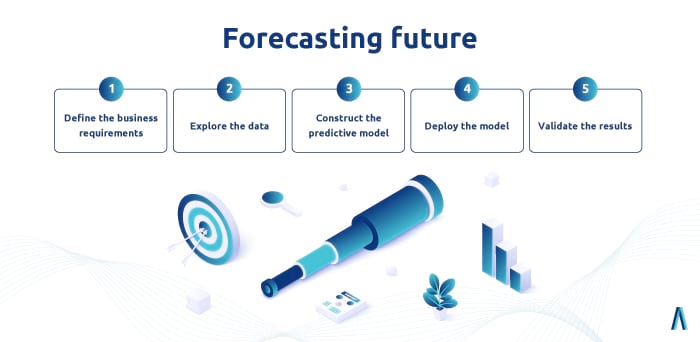
This data can help you predict buying trends and improve sales forecasting.
For example, you can use data histories of sales transactions to predict the possibility of sales transactions taking place in the future.
As a result, you can forecast sales with impressive accuracy.
The key to accurate sales forecasting using data mining is data quality. With the right approach to extraction, labelling, classification, and cataloguing, it's possible to make excellent predictions that improve your business revenue.
Use data mining to grow your business
Data mining is a powerful instrument that comes with many useful applications. Implementing a combination of them can streamline business operations, increase revenue, assist with customer service, and help you gain the position of the industry leader.
The right data mining applications are the key to the desired outcomes and error-free data processing results.
Datavid Rover is a powerful data mining tool that allows you to discover hidden value and reap top benefits from your data.
This solution helps retrieve all necessary information without spending hours searching, identifying, and categorising data.
Frequently Asked Questions
What is data mining?
Data mining is the process of extracting valuable insights and patterns from large datasets using statistical analysis and machine learning techniques.
What is the business value of data mining?
The business value of data mining lies in its ability to uncover valuable insights, patterns, and correlations from large datasets. This information can help businesses make informed decisions, improve operational efficiency, detect fraud, identify market trends, enhance customer segmentation, and gain a competitive advantage.
What is a data mining application?
A data mining application is a specific use case or domain where data mining techniques are applied to extract insights, patterns, and knowledge from large datasets. Examples of data mining applications include customer segmentation, fraud detection, market basket analysis, churn prediction, recommendation systems, and predictive maintenance.

